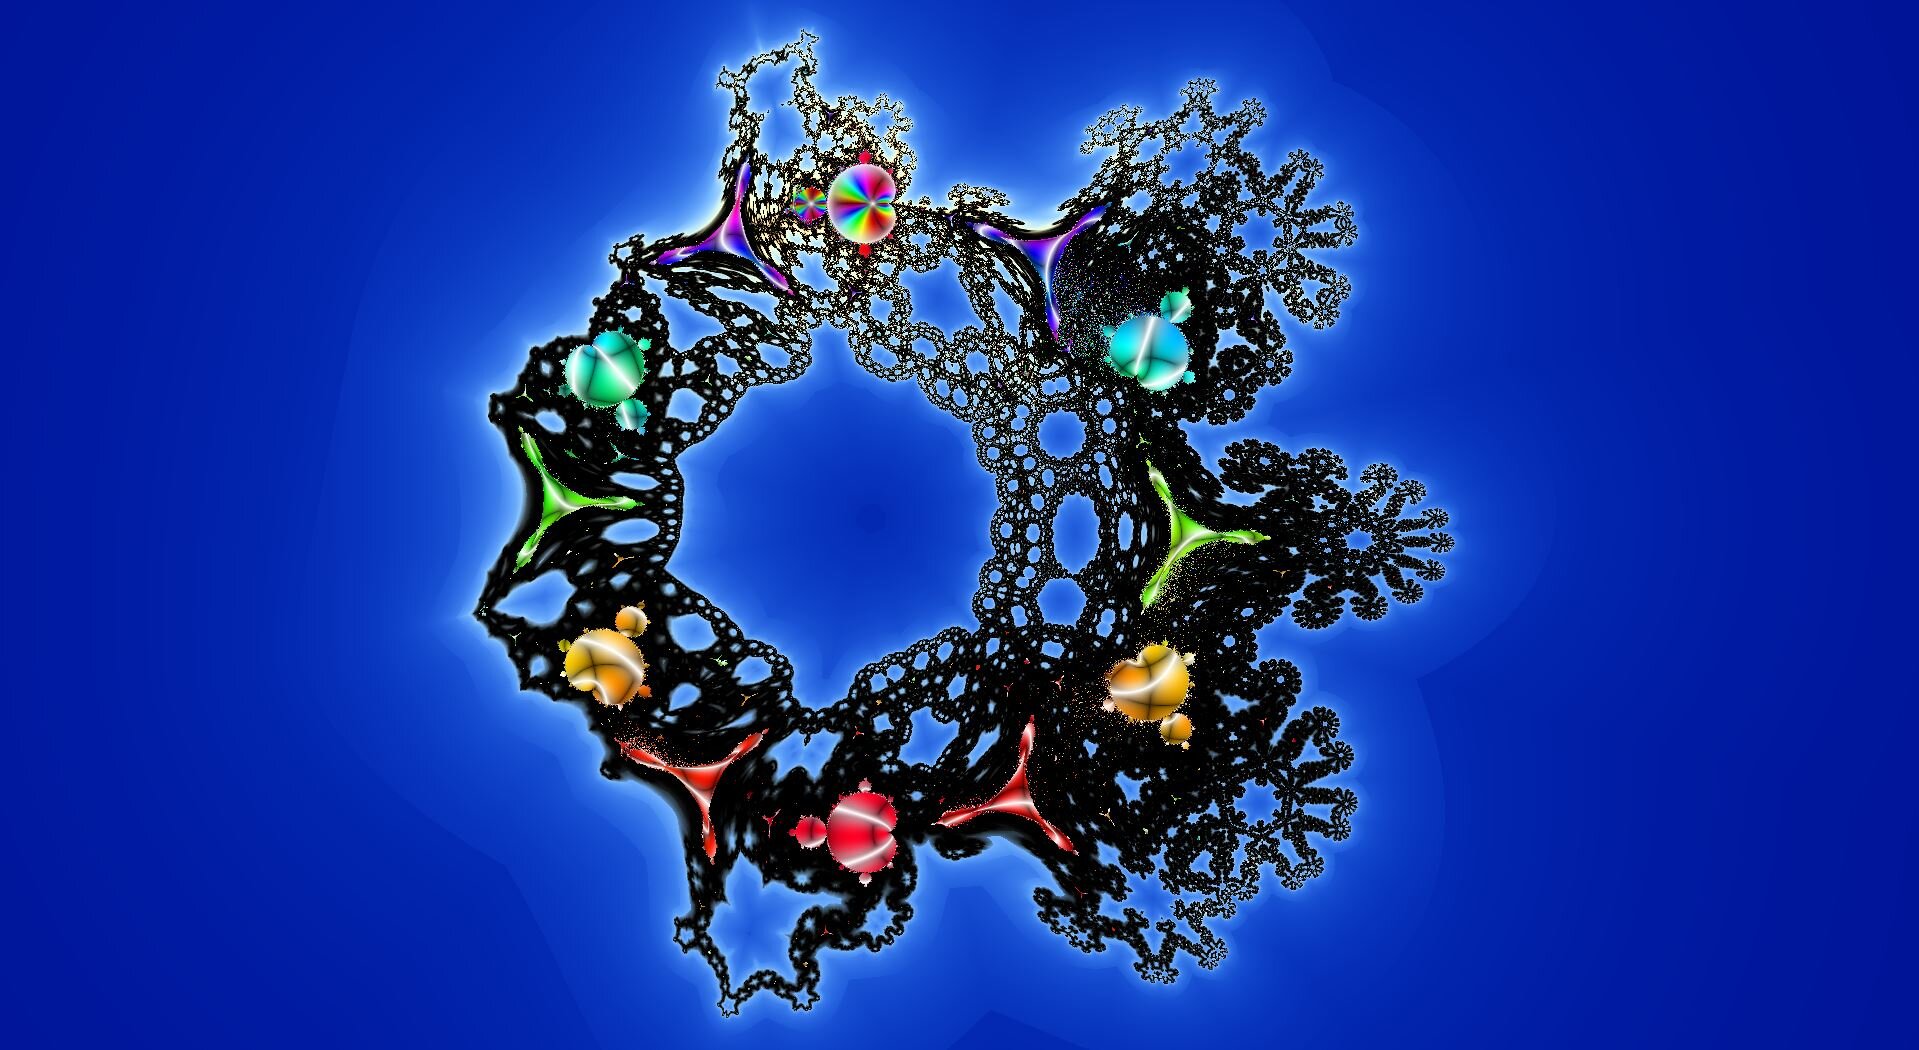
Project: Visualizing Julia and Mandelbrot Sets
Introduction
With my introduction to fractals from my fractal geometry and L-Systems projects, it was only natural that the next fractal I would implement would be the Mandelbrot Set. Producing static images representing the Mandelbrot and its Julia Sets was simple enough, but I wanted to do more than z→z^2 + c… and none of the complex number libraries I found for C# (my main language at the time) had all of the functions I wanted to use. As such, I developed my own (unoptimized) Complex class that can perform all of the evaluable functions that my PlotEquation plugin can do, but now with complex values. I spent much of my free time exploring new fractals upon its completion (especially after converting the project to OpenGL), many of which are shown in this post’s gallery. In addition, a more expansive gallery showing my fractal animations can be found here. I’ve since added the ability to project fractals onto the Riemann Sphere, which can be further explored here.
Gallery
The Classic Mandelbrot Set
The Largest “Minibrot”
The Largest Minibrot’s Largest Minibrot
Classic Mandelbrot; Center at (-1.34033, -0.0623171)
Classic Mandelbrot; Center at (-0.751693, 0.0339021)
Classic Mandelbrot; Center at (-0.750594, 0.0315353)
Classic Mandelbrot; Center at (0.270929, 0.00535877)
Classic Julia at (0.288814, 0); Bailout: 4
Classic Julia at (-0.749217, -0.148962); Center at (-1.46603, -0.0617793)
Classic Julia at (-0.754228, -0.219068); Bailout: 1.036059
Classic Julia at (-0.679692, -0.383843); Bailout: 1.036059
Classic Julia at (-0.774184, -0.113006); Bailouts (top to bottom): 0.87, 0.96, 0.99, 1.04, 1.21
Classic Julia at (-0.666273, 0.422525); Bailout: 0.935198
Classic Julia at (0.785388, 0.00404554); Bailout: 0.82252
Classic Mandelbar
Julia at (0.238389, 0); Bailout: 1.21023; Classic (left), Conjugate (right)
Julia at (0.401752, 0.49146); Bailout: 4; Classic (left), Conjugate (right)
Power 3 Mandelbrot; Classic (left), Conjugate (right)
Power 4 Julia at (0.514949, 0.607646);
Bailout: 0.931158
Power 6 Julia at (0.394578, -0.660751)
Power 1.5 Julia at (-0.192375, 0)
Power 1.5 Julia at (-0.196925, 0)
Power 3.3 Julia at (-0.435178, 0)
Power 6 Julia at (-1.13538, 0)
Power 4.5 Julia at (-0.758389, 0)
Power 2.4 Julia at (0.318606, 0)
Power 2.4 Julia Sets at (-0.70806, 0) and (-0.694209, 0)
Power 2.1 Julia at (-1.33178, 0)
Classic Lambda Set
Classic Lambda; C-Power; -0.2
Classic Lambda; C-Power; -2
Classic Lambda Set; Conjugate
Classic Lambda; C-Power; 0.5
Power -2 Lambda Julia at (-0.386444, 0.683748); Bailout: 50
Power -2 Lambda Julia at (-0.0537139, 0.377589); Bailout: 100
Power -2 Lambda Julia at (0.435366, -0.764313); Bailout: 600
Power -2 Lambda Julia at (-0.0105572, 0.21994); Bailout: 600
Power -2 Lambda Julia at (-0.201475, 0.21994); Bailout: 600
Power -2 Lambda Julia at (-0.127805, 0.219452); Bailout: 600
Classic Perpendicular Burning Ship
Classic Burning Ship
Power 3 Burning Ship
1-Fold Burning Ship; Offset by (0, 1.5)
2-Fold Burning Ship; Angle: 45, Offset by (0, 2.5)
6-Fold Burning Ship; Angle: 75, Offset by (0, 5)
6-Fold Power 4 Burning Ship; Angle: 75, Offset by (0, 5)
1-Fold Burning Ship Julia at (0, 1.5); Offset by (0, 1.5)
1-Fold Burning Ship Julia at (-1, 1.5); Offset by (0, 1.5)
1-Fold Burning Ship Julia at (-0.769118, 1.67031); Offset by (0, 1.5)
1-Fold Power 1.5 Burning Ship Julia at (-0.196925, 0); Offset by (0, 1.5)
6-Fold Power 2 Burning Ship Julia at (0, 5) and (-1, 5); Angle: 75, Offset by (0, 5)
1-Fold Power -2 Lambda Burning Ship Julia at (-1.17228, 0.992439); Offset by (0, 15)
1-Fold Power -2 Lambda Burning Ship Julia at (0, 1.5); Offset by (0, 15)
1-Fold Power -2 Lambda Burning Ship Julia at (0.83983, 0.982559); Offset by (0, 15)
1-Fold Power -2 Lambda Burning Ship Julia at (0.976915, 0.663971); Offset by (0, 15)
1-Fold Power -2 Lambda Burning Ship Julia at (0.83983, 0.982559); Offset by (0, 15)
Happy Accidents
Attempt at 10-Fold Burning Ship
Attempt at 2-Fold Burning Ship
Attempt at 1-Fold Burning Ship Julia at (-0.747417, 0.187026); Angle: 169.948
Attempt at 2-Fold Lambda Burning Ship; Angle: 135
Attempts at 5-Fold Burning Ship; C-Power: -1, Angle: 114.628
Attempt at 2-Fold Burning Ship; Angle: 36
Attempt at 2-Fold Burning Ship; Angle: 36
Attempt at 5-Fold Burning Ship; Angle: 36
Attempt at 5-Fold Burning Ship; Angle: 75.1526
Attempt at 2-Fold Burning Ship; Angle: 45


